Standard Deviation Calculator: Sample & Population (SD)
Trying to figure out how spread out or consistent your data is? Calculating standard deviation tells you exactly that, and our simple calculator gives you the answer instantly for both sample and population data sets.
Enter numbers separated by commas to calculate standard deviation, variance, mean, and more.
Results
| Standard Deviation | |
| Variance | |
| Mean | |
| Sum | |
| Count (n) | |
| Margin of Error |
Step-by-Step Calculation
Standard Deviation — A Plain-English Guide with Formulas, Examples & a Visual
How to Use Our Standard Deviation Calculator
This tool calculates the standard deviation, variance, and mean of a set of numbers. Follow these simple steps:
-
Sample or Population?: First, select whether your data set is a population (the entire group you’re interested in) or a sample (a smaller part of that group). This choice affects the formula used and is the most important step. If you’re unsure, choose sample.
-
Enter Your Data: Type or paste your numerical data into the text box. You can separate numbers with commas (e.g.,
2, 4, 6, 8), spaces (e.g.,2 4 6 8), or new lines. -
Calculate: Click the button to see your results.
Understanding Your Results
Your result isn’t just one number; it’s a small but powerful statistical summary. Here’s what each part means.
1. Mean (mu or barx): This is the average of all the numbers in your data set. It’s the central point around which your data clusters.
2. Variance (sigma2 or s2): This number measures how far each number in the set is from the mean, on average. A larger variance means the data points are very spread out; a smaller variance means they are tightly clustered around the mean. It’s calculated in squared units, which is why we need the final step.
3. Standard Deviation (sigma or s): This is the star of the show. It’s simply the square root of the variance. Taking the square root brings the measure of spread back into the same units as your original data, making it much easier to interpret.
In Simple Terms: A low standard deviation means your data points are clustered tightly around the average. A high standard deviation means your data points are spread out over a wider range of values.
Imagine two basketball players who both average 15 points per game (their mean is 15).
-
Player A (Low SD): Scores 14, 15, 16, 15, 15. This player is very consistent.
-
Player B (High SD): Scores 30, 2, 5, 20, 18. This player is very inconsistent.
They have the same average, but their standard deviations would be vastly different, telling you about their consistency.
How to Calculate Standard Deviation Manually (Step-by-Step)
Understanding the manual process helps clarify what the calculator is doing.
Concrete Example: Let’s use the data set: 2, 4, 8, 10.
Step 1: Find the Mean (Average) Calculate the average of your numbers.
-
Mean (barx) = frac2+4+8+104=frac244=6
Step 2: Find the Deviations Subtract the mean from each data point.
-
2−6=−4
-
4−6=−2
-
8−6=2
-
10−6=4
Step 3: Square the Deviations Square each result from Step 2. This removes the negative signs.
-
(−4)2=16
-
(−2)2=4
-
(2)2=4
-
(4)2=16
Step 4: Sum the Squared Deviations Add up all the numbers from Step 3.
-
Sum of Squares = 16+4+4+16=40
Step 5: Calculate the Variance This is where Sample vs. Population matters.
-
For a Population (divide by N): Variance (sigma2) = frac404=10
-
For a Sample (divide by n-1): Variance (s2) = frac404−1=frac403approx13.33
Step 6: Find the Standard Deviation Take the square root of the variance.
-
Population SD (sigma): sqrt10approx3.16
-
Sample SD (s): sqrt13.33approx3.65
Frequently Asked Questions
What is the difference between sample and population standard deviation?
This is the most common point of confusion. The difference is based on your data set.
-
Population: You have data for every single member of the group you are studying. For example, if you are calculating the average height of all students in one specific classroom, that’s a population. You use the population formula (sigma), dividing by the total number of data points (N).
-
Sample: You have data for only a portion of the group you are studying. For example, if you are calculating the average height of students in that same classroom to estimate the height of all students in the entire school, that’s a sample. You use the sample formula (s), dividing by
n-1.
Why divide by n-1 for a sample? This is a statistical adjustment called “Bessel’s correction.” It makes the sample standard deviation a more accurate, unbiased estimate of the true population standard deviation. In almost all real-world scenarios, you are working with a sample. If you’re unsure, use the sample calculation.
What is considered a “good” standard deviation?
There is no universal “good” or “bad” standard deviation. It’s entirely context-dependent.
-
In Manufacturing: A factory producing screws that must be exactly 5cm long wants a standard deviation as close to zero as possible. A low SD is good.
-
In Investing: A high-risk, high-reward stock will have a very high standard deviation in its price, reflecting volatility. An investor seeking stability would see this as bad, while a trader looking for big swings might see it as an opportunity.
-
In Education: The scores on a well-designed test are expected to have a moderate standard deviation, showing that the test effectively differentiated between students of varying knowledge levels. A very low SD might mean the test was too easy or too hard.
How does standard deviation relate to variance?
They measure the same thing (data spread), but in different units.
-
Variance is the average of the squared distances from the mean. Its units are squared (e.g., dollars-squared), which isn’t intuitive.
-
Standard Deviation is the square root of the variance. This returns the measure of spread to the original units of the data (e.g., dollars), making it much easier to interpret and apply.
What does a low standard deviation mean?
A low standard deviation indicates that the data points tend to be very close to the mean (the average). It signifies high consistency, low variability, and predictability. For example, the daily temperature in San Diego has a low standard deviation.
What does a high standard deviation mean?
A high standard deviation indicates that the data points are spread out over a wider range of values. It signifies low consistency, high variability, and less predictability. For example, the daily temperature in St. Louis has a high standard deviation.
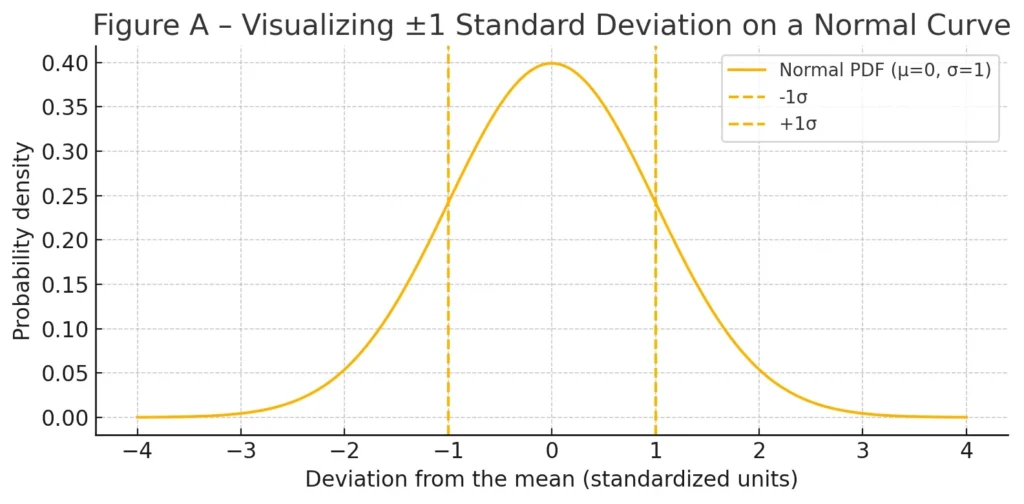
What is the 68-95-99.7 Rule?
Also known as the Empirical Rule, this is a key guideline for data that follows a normal distribution (a bell-shaped curve):
-
Approximately 68% of the data falls within 1 standard deviation of the mean.
-
Approximately 95% of the data falls within 2 standard deviations of the mean.
-
Approximately 99.7% of the data falls within 3 standard deviations of the mean.
This rule provides a quick way to understand the spread of data and identify potential outliers.
How is standard deviation used in finance?
In finance, standard deviation is the primary measure of volatility or risk.
-
A stock with a high standard deviation has experienced wide price swings, making it a riskier investment.
-
A mutual fund or index with a low standard deviation is more stable and less risky.
-
Financial analysts use it to build portfolios that match a client’s risk tolerance.
What happens if all the numbers in a data set are the same?
If all numbers in a data set are identical (e.g., 8, 8, 8, 8), the standard deviation is 0. This is because there is no spread or variation in the data—every single point is exactly at the mean.
Can standard deviation be negative?
No, standard deviation can never be negative. It is calculated from the square root of the variance, and variance itself is calculated from squared values (which are always non-negative). The smallest possible value for standard deviation is 0.
What are the formulas for standard deviation?
-
Population Standard Deviation (sigma): sigma=sqrtfracsum_i=1N(x_i−mu)2N
-
Sample Standard Deviation (s): s=sqrtfracsum_i=1n(x_i−barx)2n−1
Where:
-
sum = The sum of
-
x_i = Each individual data point
-
mu or barx = The mean of the data set
-
N or n = The number of data points
Now that you understand the spread of your data, you can calculate the exact average with our Mean, Median, Mode Calculator. If you need to see how a specific data point compares to the rest, use our Z-Score Calculator.
Creator